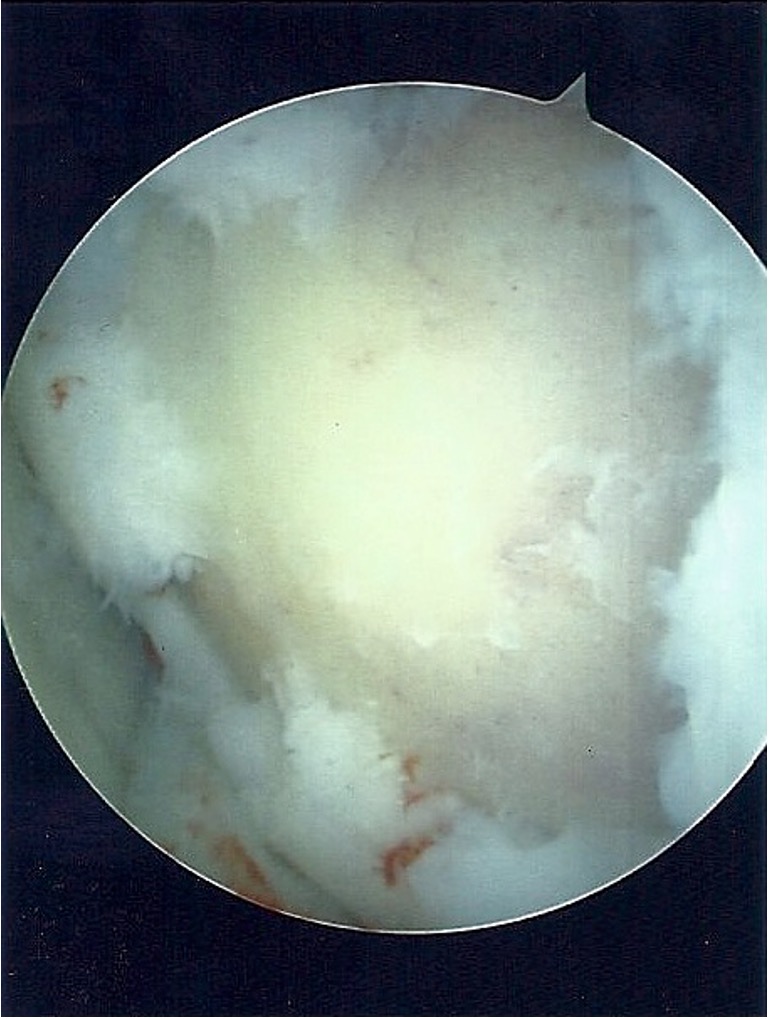
Overview
T2 relaxation time is a quantitative magnetic resonance imaging (qMRI) parameter that reflects the interactions between water molecules and the collagen-proteoglycan matrix within cartilage tissue. Because it is sensitive to tissue composition and organization, T2 mapping provides a noninvasive biomarker of cartilage health, degeneration, and repair.
Biophysical Basis
In MRI, T2 relaxation refers to the decay of transverse magnetization due to spin–spin interactions. In articular cartilage, these interactions are influenced primarily by:
- Collagen fiber orientation and integrity: Organized collagen fibrils restrict water mobility, leading to shorter T2 times. Disorganization or disruption, as seen in degeneration, increases T2.
- Water content: Higher free water content lengthens T2 relaxation time.
- Macromolecular environment: Changes in proteoglycan concentration indirectly affect T2 through altered collagen–water interactions.
Methodology
T2 mapping involves multi-echo spin echo or gradient echo MRI sequences that capture signal decay at multiple echo times. The voxel-wise signal decay curve is fit to an exponential model to estimate T2 relaxation time, producing a quantitative map of T2 values across cartilage.
Acquisition parameters:
- Field strength: typically 1.5T or 3T
- Slice thickness: 2–4 mm
- In-plane resolution: 0.3–0.6 mm
- Common sequences: multi-echo SE, CPMG, or T2-prepared 3D GRE
Analysis:
T2 values are averaged over anatomically defined regions of interest (ROIs) or segmented cartilage compartments. Laminar (depth-dependent) analysis can detect early matrix alterations before morphologic loss becomes apparent.
Applications
- Early detection of degeneration: Elevated T2 values indicate early cartilage matrix disruption in osteoarthritis or following joint injury.
- Evaluation of cartilage repair tissue: T2 mapping is used in clinical trials of cell-based or scaffold-based cartilage repair to assess tissue maturation and integration.
- Longitudinal monitoring: T2 changes can track disease progression or response to therapy.
Limitations
- Sensitive to magic-angle effects (collagen orientation relative to B₀ field).
- Affected by sequence parameters and scanner differences—requiring standardization for multicenter trials.
- Reflects water–collagen interactions but not proteoglycan content directly (T1ρ or dGEMRIC may provide complementary information).
Qmetrics Unique Advantages
High-resolution, high coverage acquisitions – Qmetrics designed a high-resolution, dual-echo spin-echo sequence that provides full knee coverage while supporting efficient imaging times which reduce patient motion
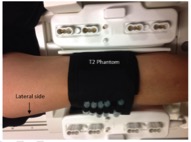
Proprietary Standardization – Qmetrics standardizes imaging protocols across all sites regardless of scanner brand, using a set of chemical phantoms to support data pooling and analysis accuracy.
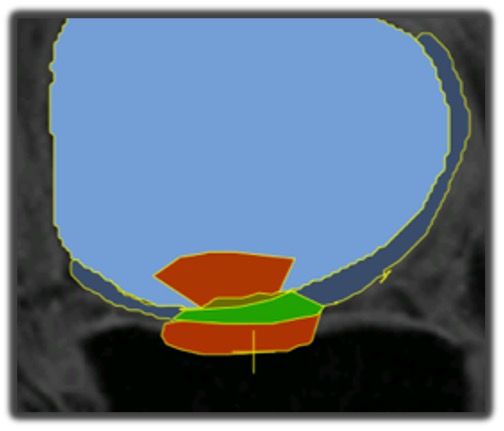
Technology-guided Segmentation and Analysis – Qmetrics offers a variety of segmentation approaches, ranging from automated atlas-based to expert manual tracing, and algorithmically-guided T2 measurement for anatomic sub-regions, and cartilage laminar analysis.
Conclusion
T2 relaxation time mapping is a validated, noninvasive MRI biomarker for assessing cartilage structure and quality. When standardized and properly analyzed, it offers valuable insights into early degenerative changes and the repair process in both clinical and research settings.